StoryMap JS Tutorial
In this lesson, you will learn how to create a Narrative Map, which tells a story through space. A narrative map could trace an Oregon Trail traveler’s movement through space using a diary or guidebook; it could plot the images on the map to show the distribution of the wreckage from the 1906 earthquake in SF; or it could trace the development of a city block using rich multimedia (videos, images, soundclips, and text). Narrative focus on storytelling, rather than on plotting massive quantities of data; and they can embed or integrate a variety of rich multimedia.
The tool we will use to create these narrative maps is StoryMap JS, a tool created by KnightLab. This tutorial will walk you through how to create a narrative map using this tool.
What is StoryMapJS?
StoryMapJS is free online software that lets you tell a story with media — including images, video or audio – and augment that story by displaying specific locations on a map. It’s one of many projects developed, hosted and freely shared by Knight Lab, part of Northwestern University.
A screengrab of one of the example StoryMaps on the site shows what a “slide” might look like.

A slide is made up of four elements:
- A map location on the left side of the slide. A location is required for each slide.
Then at least one of the next three elements is required, but you can include any combination of the three on the right side to the screen.
- Some kind of media such as an image, a video or even audio.
- A headline and some textual content which can include HTML and
- A background color or image to provide a nice aesthetic feel to the slide.
So slides always require a map location on the left, and on the right side need to have at least one kind of media, but can have any variation of the other three elements.
Creating a New StoryMap
Logging in to the StoryMapJS Authoring Tool
StoryMapJS uses your Google Account for authentication so naturally you’ll need a Google account to make use of the service. Make sure you’re logged in to a Google service (Gmail for example) and then browse to: https://storymap.knightlab.com/
Click on the big green Make a StoryMap button. You can’t miss it! 🙂

Sign in with your Google account by clicking the button.

Choose an account to sign in with.

The “Your StoryMaps” dialog will appear. To create a new one, click the “New” button.

Give your StoryMap a title (you can change it later if you want) and then click “Create”.

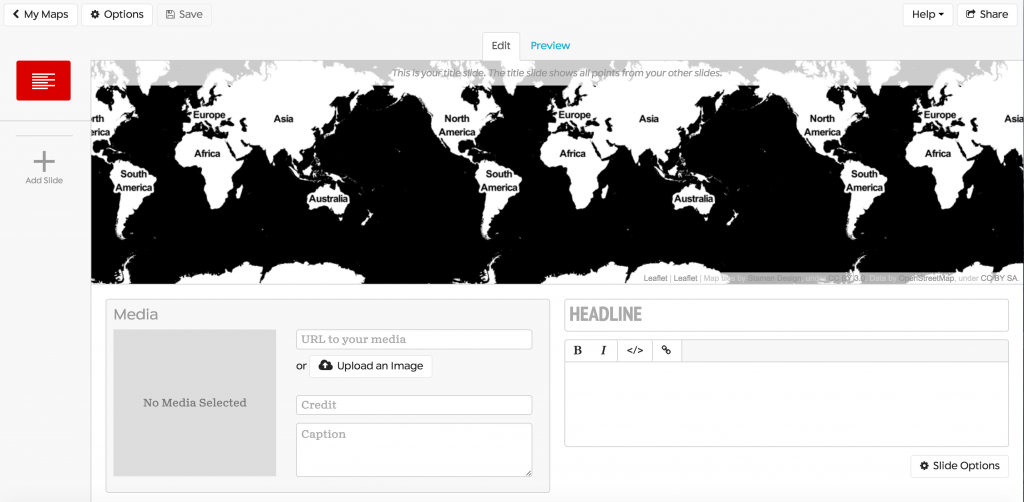
The StoryMapJS authoring Tool will appear ready for you to add content to the StoryMap’s title slide.
StoryMap Options

To open the StoryMap JS options, click the “Options” ( ) button on the upper-left of the screen next to “save” (
 ). This is where you can manipulate your language and font. More importantly, this is also where you can:
- Set the proportions of your StoryMap for your final presentation.
- Set the background to cartography or image.
- Cartography: StoryMapJS draws lines to connect your map location markers
- Image: only the location markers appear.
- Choose to rename the “call to action” button to fit your specific project.
- The call to action is the text button on the title slide which prompts your visitor to move on to the content slides. By default, the text says “Start Exploring”
- Change the background map type or use a custom map/image relevant to your work (which might dictate what you do with 2).
We recommend you play with these options as you assemble your content.
Change your basemap (optional)

To change the map in the background of your project:
- Click on “Options” in the upper-right side of your browser window.
- Decide whether you want to treat the background as cartography (a map) or an image.
- Decide if you want to leave your “call to action” with the default or stylize it to your preference.
- Look through the basemap types -or- choose from the last four options to highly specialize your project.

- If you customize your basemap, we recommend you choose “custom” and select from the georeferenced maps with the David Rumsey Collection. Georeferenced maps are already set up to work with programs like StoryMap JS and easy to plugin.
- To do so, pick your map in the Rumsey collection.
- Make sure you are looking at “This Map” and not just a preview.
- Look for the “Use in GIS apps” information and click “Get Links.”
- Copy the “XYZ link” under “custom” in StoryMap JS.
- Full tutorial on using the David Rumsey Collection for a custom map
- If you customize your basemap, we recommend you choose “custom” and select from the georeferenced maps with the David Rumsey Collection. Georeferenced maps are already set up to work with programs like StoryMap JS and easy to plugin.
- Click “Close” to save your changes.
A Quick Tour of the StoryMapJS Authoring Tool
When you create a new StoryMap, the title slide is the first screen you see in the authoring tool. Let’s go through the sections of the authoring tool.
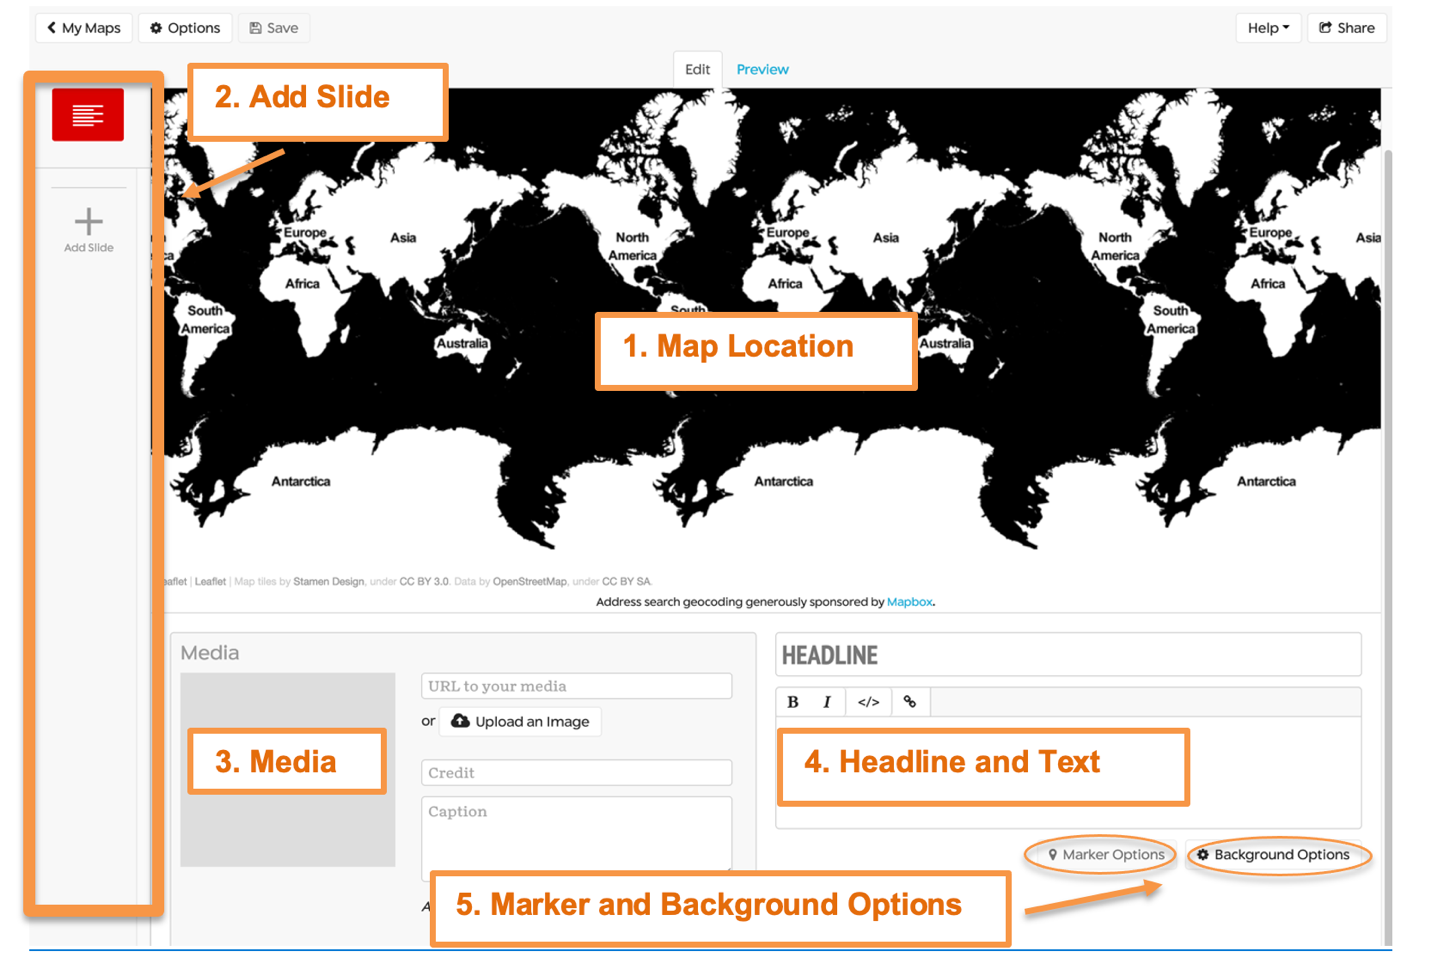
- Map Location: This is where you set the location on your map. Since this is the title slide, no search bar appears to add a location to this particular slide.
- Add Slide: This column displays slide icons. The title slide is shown in red. The plus icon labelled “Add Slide” allows you to add more slides (locations) to your Story Map.
- Media: The Media section allows you to upload images or link to images, video streaming services (e.g., YouTube, Vimeo, SoundCloud, etc.) to your slide.
- Headline and Text: Here is where you can add a headline or title for each slide with some descriptive text to write your narrative. The text box has bold, italic, and hyperlink buttons. It also includes an Edit HTML button “</>”, so you can view the text you add with HTML tags.
- Marker and Background Options: Here is where you can add customized markers for each point on your map. Under Background Options, you can add a background color or image for your header and text. Since this is the title page, the Marker Options are grayed out because you haven’t added a location yet. Once you have added another slide and a location, you can then click on the Marker Options to customize the points on your map.
StoryMap Slides
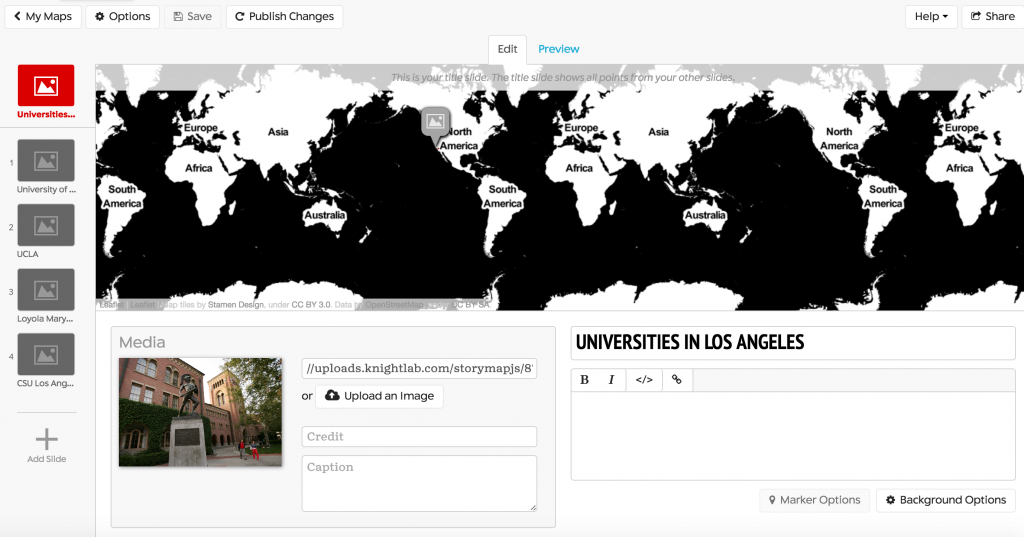
Now you can start creating your slides. Add a headline, description, media, credit and caption for your media. You can add an image from your computer or a url to an image on the web or YouTube video. I recommend uploading your media to avoid broken images later if your source ends up getting deleted. You can toggle back and forth between edit and preview. Use the search bar to find the location. Keep adding slides until you are done.
Your map will have three sections. On the left, your Slides for each marker. The slide at the top is the Title slide and doesn’t have a location associated with it. Click Add Slide to add a new slide. If you are editing a slide, it will be red.
The bottom portion of the map has an area for Media, a Headline, and Text and this corresponds to the information on each marker/slide.
StoryMap Slides: Media Each slide will have one Media object associated with it. There is also a space to put a caption for the media, and credit. You can use a direct link to media that you find on the Internet, such as an image, YouTube or Vimeo video, a SoundCloud audio file, etc. You can also upload an image that you have saved on your computer. If you are using a link to an image already on the Internet, the link has to end with .png, .jpg, .gif, or .jpeg.
To properly include your media (the digital facsimile of the painting, letter, or other documents you selected), you need to:
- Insert the media (either as an upload or using a link directly to the digital facsimile).
- Include a credit to the institution holding the document.
- Use the caption to include the alt text and the appropriate full note citation for the document.
Including well written alt text in the caption is vital for accessibility, but it also helps everyone understand the context and purpose for your image.
The citation acknowledges who created the text and how the reader can find it. It’s important to provide that information following an established standard in order to 1) ensure you have all relevant information and 2) make it easier for the reader to engage the material.
StoryMap Slides: Text The text is where you need to explain how your chosen documents connect to your chosen theme. Here, you need both a headline (1) and text (2).
- The headline should encapsulate what you want your reader to understand about your chosen media (e.g., Tulips in 19th century Amsterdam)
- The text should build on the title, explaining what your chosen media says about your theme.
Working with that text box, you can format your text or add links using the buttons located above the text bar.
- The “B” puts your text in bold. If you use HTML, that would be the <strong> tag.
- The “I” puts your text in italics. Using HTML, that would be the <em> for ’emboss.’
- Click the “</>” button if you want to use HTML to code your text.
- The chain icon symbolizes a link. The button is to add a hyperlink to your text.
Title Slide
Your first slide will be your title slide. The title slide will show all of your locations, whereas each individual slide will just show that slide’s location.
On this slide, the headline will be the title for your entire map, and the text description will be an introduction of sorts to the rest of your presentation.
You won’t be able to change the position of the title slide or change a content slide to become the title slide.
Content Slides
The majority of slides in your Storymap will be content slides. Each content slide represents a single location or point in your project.
Content slides should each include a location, their own piece of media (be it image, letter, or otherwise), the appropriate attribution, and text explaining to the reader how they should understand your chosen object.
You add new slide by clicking the Add Slide Button in the left column.

StoryMap Slides: Location
The only change you’ll see from the title slide is you now have a search field to find locations on the map. You can search for a location like a city or an address. Once you have located the place you’re looking for, you can zoom in on the map using the “+” button in the upper left and then click, hold and drag the map marker to wherever you want on the map.
Enter the content slide’s location in the text box at the bottom of the map portion.
If you’re having trouble seeing the location box, you can use Edit > Find and type in “Search for a location” the text in the box will highlight making it easier to see.
Type in a the name of a city, a landmark, or a street address in the location box.
If you don’t find what you’re looking for, remember the map is using items from a conventional travel map. You may need to find latitude and longitude or another site close by.
Adding a Background Image (or Color) to a Slide
You can add a background color or a background image to the right side of the screen.
To see the “Slide Background” dialog box, click the “Background Options” button at the lower right.

Add a Background Color
To add a background color, click inside of the “Background Color” field and a color picker appears. The field only accepts color hex values but the color picker lets you find the hex value if you drag the picker and use the coloured column at the right to chose the color you want.

Add a Background Image
You can add a background image by pasting the URL of an image hosted on the web into the “Background Image” field or by uploading an image. Other images you have uploaded to this StoryMap are available by clicking the down arrow at the left.
The opacity of background images is automatically altered so that text is easy to read, even with a somewhat busy image in the background.
Embedding Your StoryMap on a Webpage
To share the map with other people, click on the “Share” button in the top right corner of your preview screen. For this, you grab the embed code:
Embedding your StoryMap on a webpage or blog post displays it on the page itself by using the HTML “iframe” tag. The advantage of embedding your StoryMap on your web page or blog post is your visitors don’t leave your site in order to experience the cool content you’ve created.

For example, here are the steps to embed your StoryMap in a WordPress post.
- Copy the embed code from the Share dialog box.
- Assuming you’re using WordPress’s newer Gutenberg editor, you’ll want to use the “Custom HTML” block. Paste the embed code into the “Custom HTML” block, save the post as a draft (or publish it) and view the post.
Note: If you’re using WordPress’s “Classic” editor, you’ll need to paste the code into the “Text” tab which displays your post along with any HTML markup that has been applied to it.
Best practices for StoryMapJS
- Use Chrome or Firefox! The Preview function in the web editor can be weird sometimes as well, so Save, refresh, and try again.
- Be clear and concise! o Link out to other webpages instead of trying to put too much information on a single pin.
- Each pin’s headline should reinforce the content and draw in users to read more.
- StoryMapJS forces you to think economically when it comes to the space it gives you. Make each word/image count!
- Save your data elsewhere! o Copy/paste your text from another source into the web interface.
- StoryMapJS has a tendency to glitch a lot, so save often (and remember to Publish Changes).
- Pick interesting points on the map!
- It should be clear why you are annotating each point. o The points should tie together in a meaningful way.
- Tell a story, make an argument!
- Use additional images as a way to supplement your markers!
- Crediting media is important!
- At the very least, you should include:
- The title of the media The creator of the media (author)
- A link back to where it was found originally
- Don’t worry about things like trying to do indents or italics, this isn’t citation, it is attribution. What is the difference?
- Citation = tracing back a scholarly argument to its original source. Citations are usually discipline-based and very structured in how they are laid out.
- Attribution = giving credit to the creator of something. There’s no one right way to do a citation (but the guide for this course has best practices).
- At the very least, you should include:
- Use HTML/CSS for additional stuff! o If you have knowledge of HTML and CSS, you can do more stuff with the map to add additional links, images, and effects.
Additional Resources
StoryMapJS FAQ: A list of frequently asked questions curated by the Knight Lab team.
Example StoryMaps: A list of demo projects curated by the Knight Lab team.