Lesson: Google Maps
Google Maps
Google Maps provides an easy way to start creating digital maps. With a Google Account you can create and edit personal maps.
Google Maps allows users to import and add data onto the map to visualize trends. In Maps you can choose between several different base maps (including the standard satellite, terrain, or standard maps) and add points, lines and polygons. It is also possible to import data from a spreadsheet, if you have columns with geographical information (i.e. longitudes and latitudes or place names). This automates a formerly complex task known as geocoding. Not only is this one of the easiest ways to begin plotting your historical data on a map, but it also has the power of Google’s search engine. As you read about unfamiliar places in historical documents, journal articles or books, you can search for them using Google Maps. It is then possible to mark numerous locations and explore how they relate to each other geographically. Your personal maps are saved by Google (in their cloud), meaning you can access them from any computer with an internet connection. You can keep them private or embed them in your website or blog. Finally, you can export your points, lines, and polygons as KML files and open them in Google Earth or Quantum GIS.
Getting Started:
- Open your favorite browser
- Go to Google’s Google Maps Interface.
- Log in to your Google Account if you aren’t already logged in (follow the basic instructions to create an account if necessary)
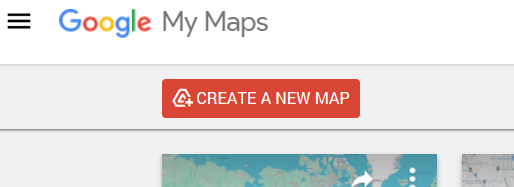
- In the Google Maps interface, click on “Create New Map” to get started
- This will open a map in a new tab that you can customize in one of two ways: by drawing points and shapes manually or by importing a spreadsheet.
- At the upper left corner, a menu box appears, titled “Untitled Map.” By clicking on the title, you can rename as “My test map” or a title of your choice.

- The map next prompts you to search for a place in the search bar. Try searching the location of your current research project. You can then click on the location and add it to your map by clicking “add to map.” This is the simplest method of adding points to your new map. Try searching for some historical place names that no longer exist (Ontario’s Berlin or Constantinople). You will find mixed results, where Google often identifies the correct location, but also offers up incorrect alternatives. This is important to keep in mind when creating spreadsheet, as it is normally better to use the modern place names and avoid risking that Google with choose the wrong Constantinople.
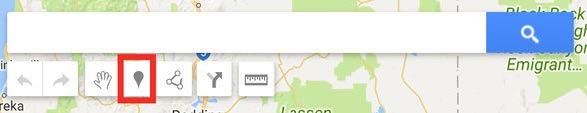
- To create points on your map, simply select the “Add Marker” tool near the search bar, then click the place on your map where you want the point to go.
- Give your point a title and a description when prompted
- You can adjust the color and the icon style for the point you just created by clicking on the paint bucket icon. This will show you various color and icon options.
- By default, Google will show you its most popular icons, but there is also a whole icon library that you can explore by clicking “More Icons.” (You can also import a custom icon from the web, using resources like the Noun Project.)
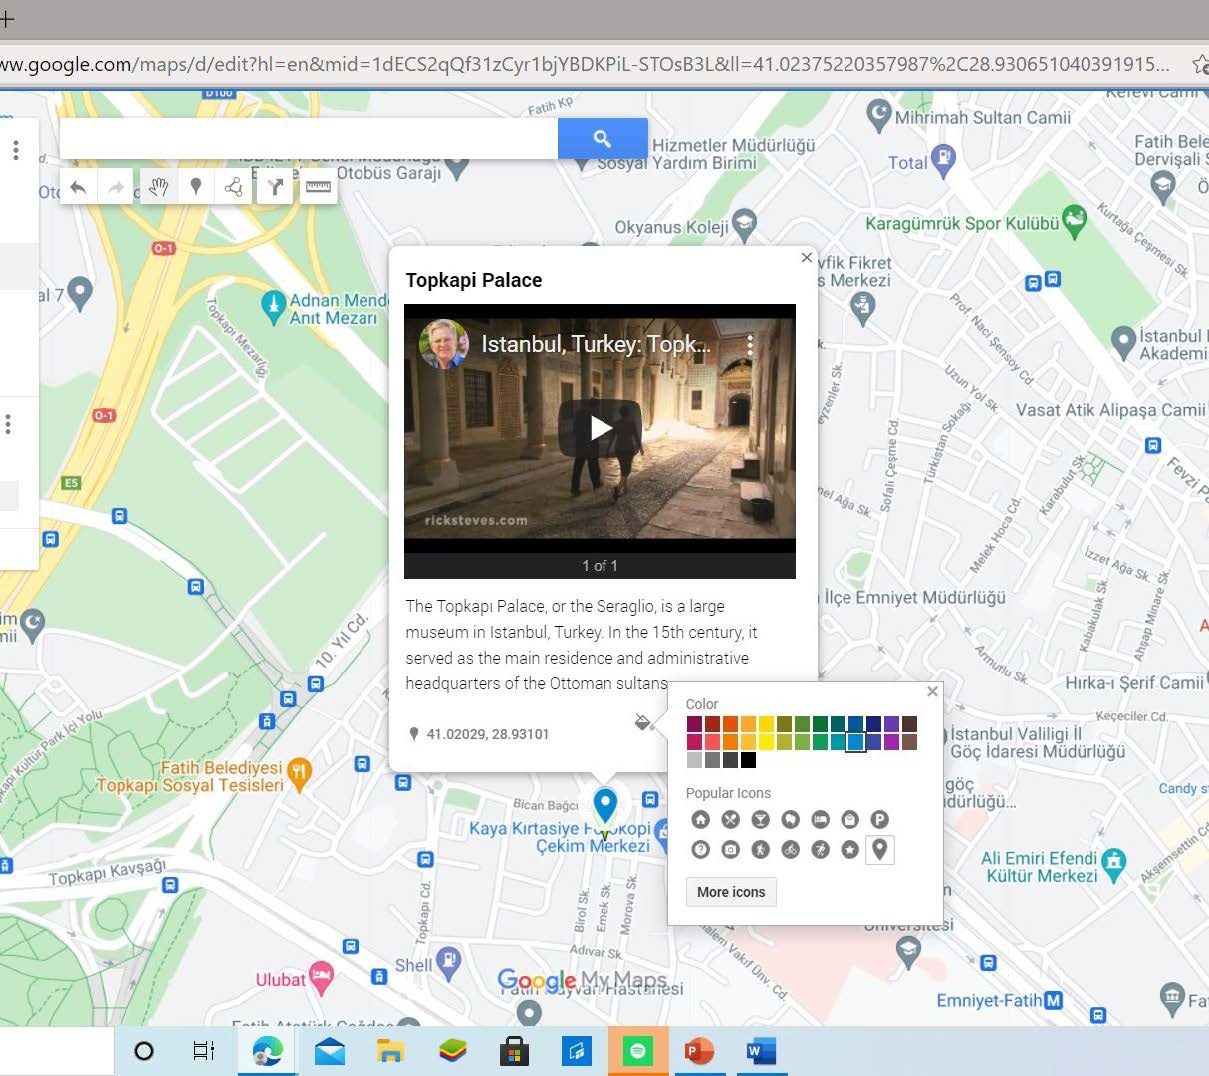
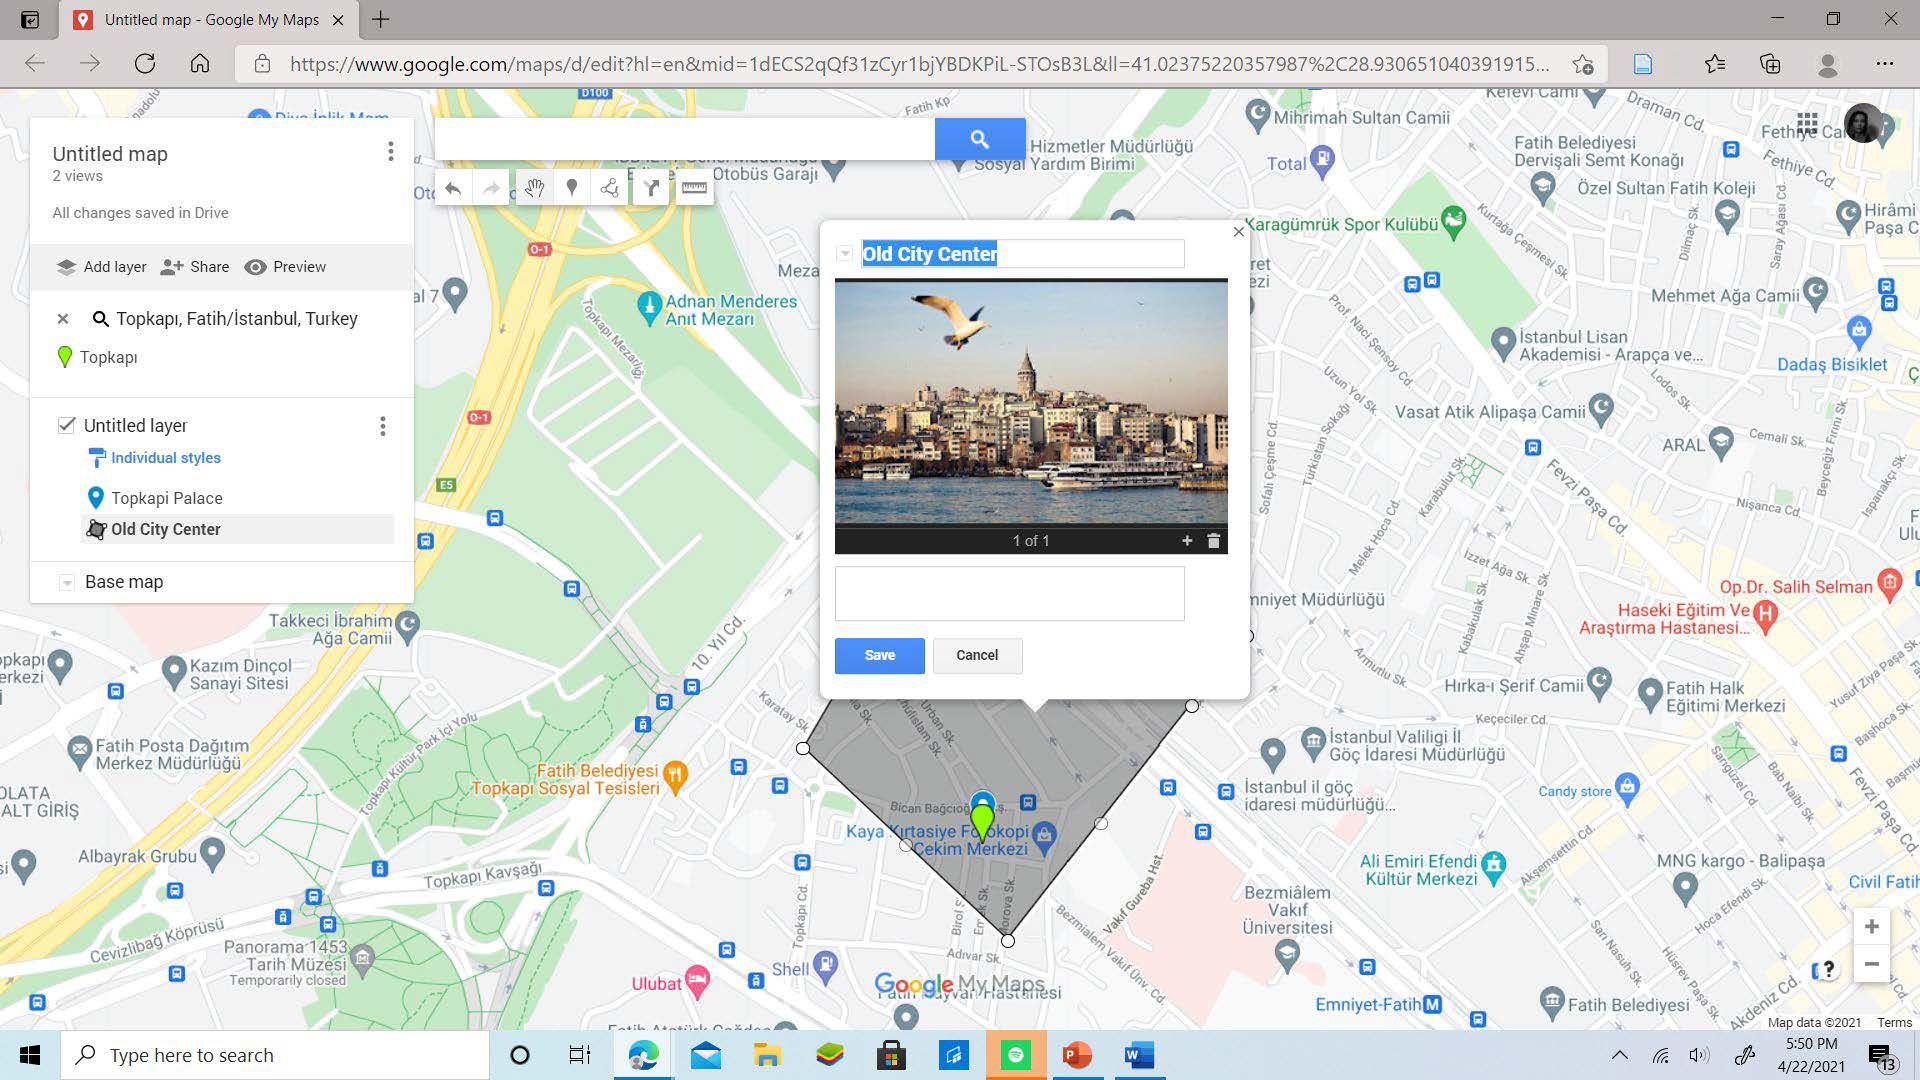
- There are other options, as well. You can add photos, videos, and description/narrative to each marker by clicking “edit” from the marker or the left-hand menu:
- Upload a photo file from your computer or from your Google Drive
- Take a photo with your web camera
- Add an image from the web via url or via Google Image Search
- Add a YouTube link via url or via search
- Once you’ve chosen an image or video link you’d like to use, hit save and it will be added to your marker or shape. You can also create a gallery with multiple images and/or video links by clicking on the “+” button on the bottom right-hand side before saving.
Creating some lines/shapes
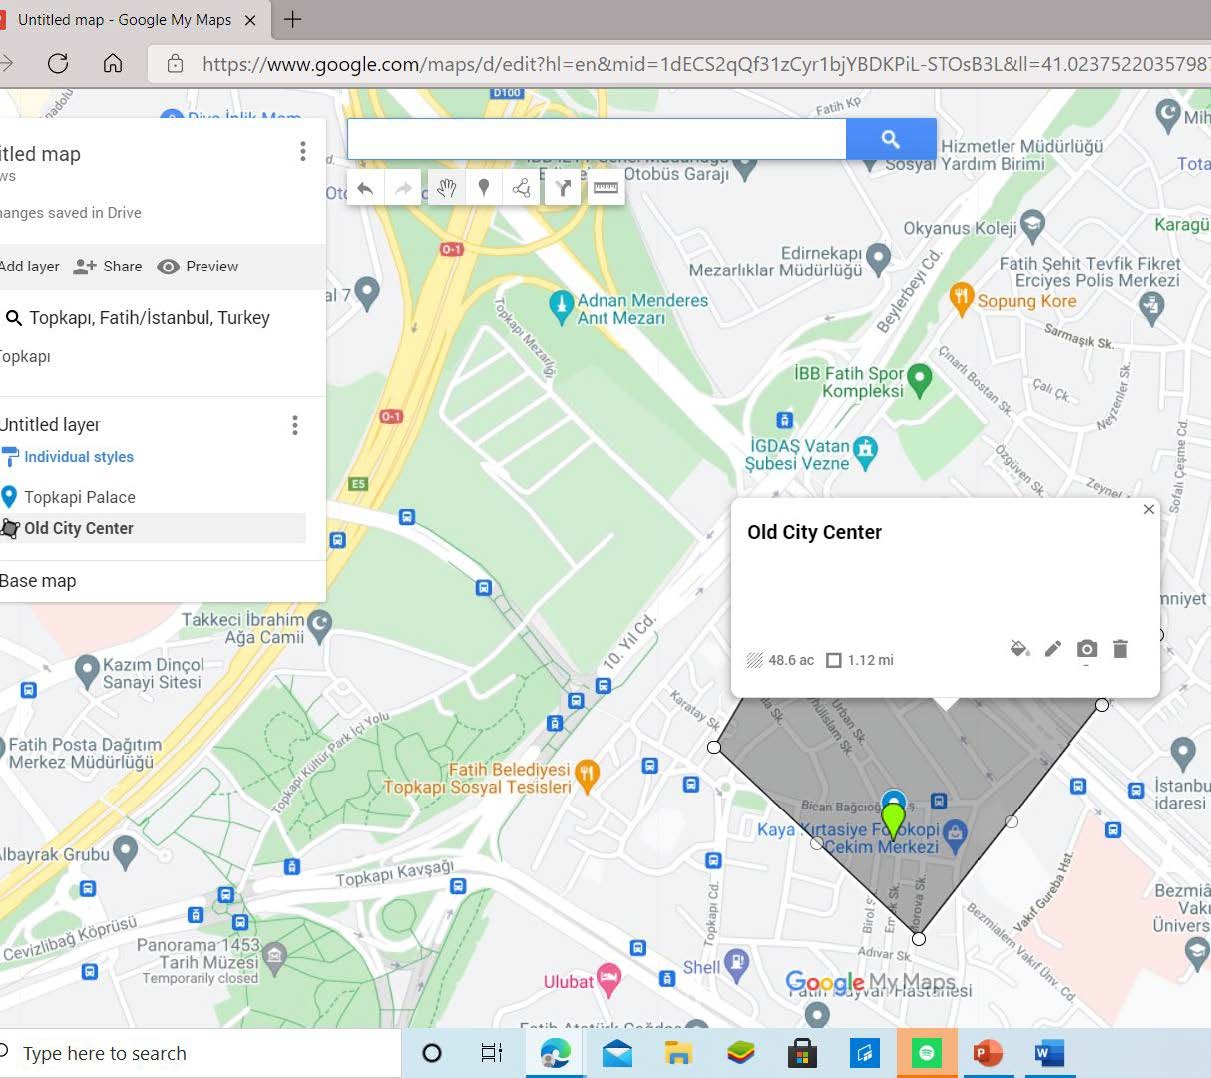
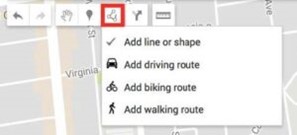
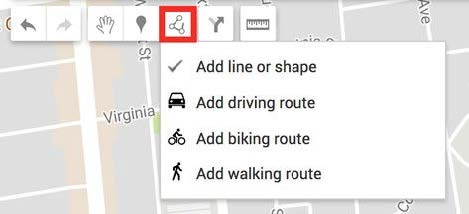
- You can also create lines or shapes on your map as well by clicking the “Draw a Line” tool. You’ll see several options from the dropdown menu, including ones for creating driving, biking, and walking routes. For the moment, let’s just use the “Add a line or shape” tool.
- Now we will add some lines and shapes (called polygons in GIS software). Adding lines and polygons is a very similar process. We will draw some lines in a new layer (different types of points, lines, and shapes should be in separate layers).
- Click the “add line or shape” icon box directly to the right of the Markers symbol:
- Pick an area and click with your mouse along it, tracing the route for a while. Hit “enter” when you want to finish the line.
Customizing Your Base Map:
- Take a look at the left-hand side of your screen. You’ll notice a box that shows information about your map, as well as the various layers that comprise it.
- So far, all the changes we’ve made have been to a layer on top of the map that we see. But you can also change the style of the map itself. To do so, click the small arrow next to the “Base Map” layer. You’ll see several map styles from which you can choose.
Working with Data Sets:
- Maps next prompts you to Import a Dataset. Click the ADD Layer button. Then click the Import.

- A new window will pop up and give you the option of importing a CSV or XLXS file. These are two common spreadsheet formats; CSV (comma separated value) is simple and universal, XLXS is the MS Excel format. You can also work with a Google spreadsheet from your Drive account.

- Download this sample data and located it on your computer: UK Global Fat Supply 1894-1896 – Sheet1. If you open the file in Excel or another spreadsheet program, you’ll find a simple two column dataset with a list of different kinds of fats and the associated list of places. This data was created using British import tables from 1896.

- Drag the file into the box provided by Google Maps.
- You will then be prompted to choose which column Google should use to identify the location. Choose Place.

- You will then be promoted again to choose which column should be used for the label. Choose “Commodity”.
- You should now have a global map of the major exporters of fat to Britain during the mid-1890s.

- You can now explore the data in more detail and change the Style to distinguish between the different types of fats.
- Click on the UK Global Fats Layer, then click on Style and finally click on Uniform Style and change it to Style by Data Column: Commodities. On the left hand side, the legend will show the amount of occurrences of each style in brackets, e.g. “Flax Seeds (4)”.


- Continue to play with the options.
- This feature provides a powerful tool to display historical datasets. It does have limitations, however, as Google Maps will only import the first 100 rows of a spreadsheet. At this point it only allows you to include three datasets in a map, so a maximum of 300 features.
Creating Vector Layers
At this stage of the tutorial, we create map layers (known more formally as vector layers). Vector layers are one of the main components of digital mapping (including GIS). They are simply points, lines, or polygons used to represent geographic features. Points can be used to identify and label key locations, lines are often used for streets or railroads, and polygons allow you to represent area (fields, buildings, city wards, etc). They work the same in Google Maps as they do in GIS. The big limitation is that you can only add limited information into the database tables associated with the points, lines, or polygons. This is a problem as you scale up your digital mapping research, but it is not a problem when you are starting out. In Google Maps you can add a label, a text description, and links to a website or photo.
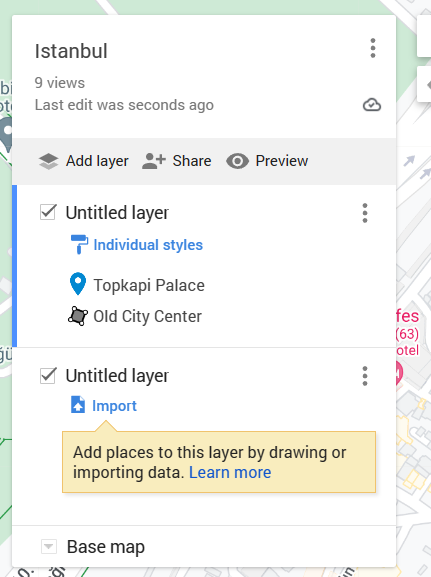
- To add a layer, you can either click on the layer that has been created for you in the menu box, with the name “Untitled Layer.” Click on “Untitled Layer” and rename it “Layer 1.” Or you can create another layer: click on the “Add layer” button. This will add a new “Untitled Layer” which you can name as “Layer 2.” It should look like this:

- Note that to the right of Layer there is a checkbox – unchecking this box turns off (i.e. it doesn’t appear on the map) a layer and its information. Uncheck the UK Global Fats layer and click on Layer 1.
- Before adding vector layers we should consider which base map to use. At the bottom of the menu window, there is a line that says “base map.” A base map is a map depicting background reference information such as roads, borders, landforms, etc. on top of which layers containing different types of spatial information can be placed. Google’s Maps Engine allows you to choose from a variety of base maps, depending on the kind of map you want to create. Satellite imagery is becoming a standard form of base map, but it is information-rich and may detract from the other map features you are trying to highlight. Some simple alternatives include “light landmass,” or even “light political” if you require political boundaries.
- Click on the arrow to the right of “Base map” in the window; a submenu appears allowing you to choose different types of base maps. Choose “Satellite”.
- Start by adding some Placemarks (the Google equivalent of a point). Click on the add Markers button underneath the search bar near the top of the window. Click on the spot on the map where you want the Placemark to appear.

- A box will pop up and give you the opportunity to label the Placemark and add a description into the text box. We added Charlottetown and included that it was founded in 1765 in the description box.

- Add a few more points, including labels and descriptions.
- You will notice that your Placemark now appears under Layer 1 on the left of the screen in your menu window. There is a place to change icon shape and icon color if you click on the symbol just to the right of the Placemark name. Also, directly under the title Layer 1 there are menus titled Style, Data, and Labels. The Style menu controls different aspects of the Layer’s appearance, while Data shows you the data you added in the description box for your Placemark. Labels menu allows you to control whether the name or description of your Placemark appears besides it on the actual map.

Share your custom map
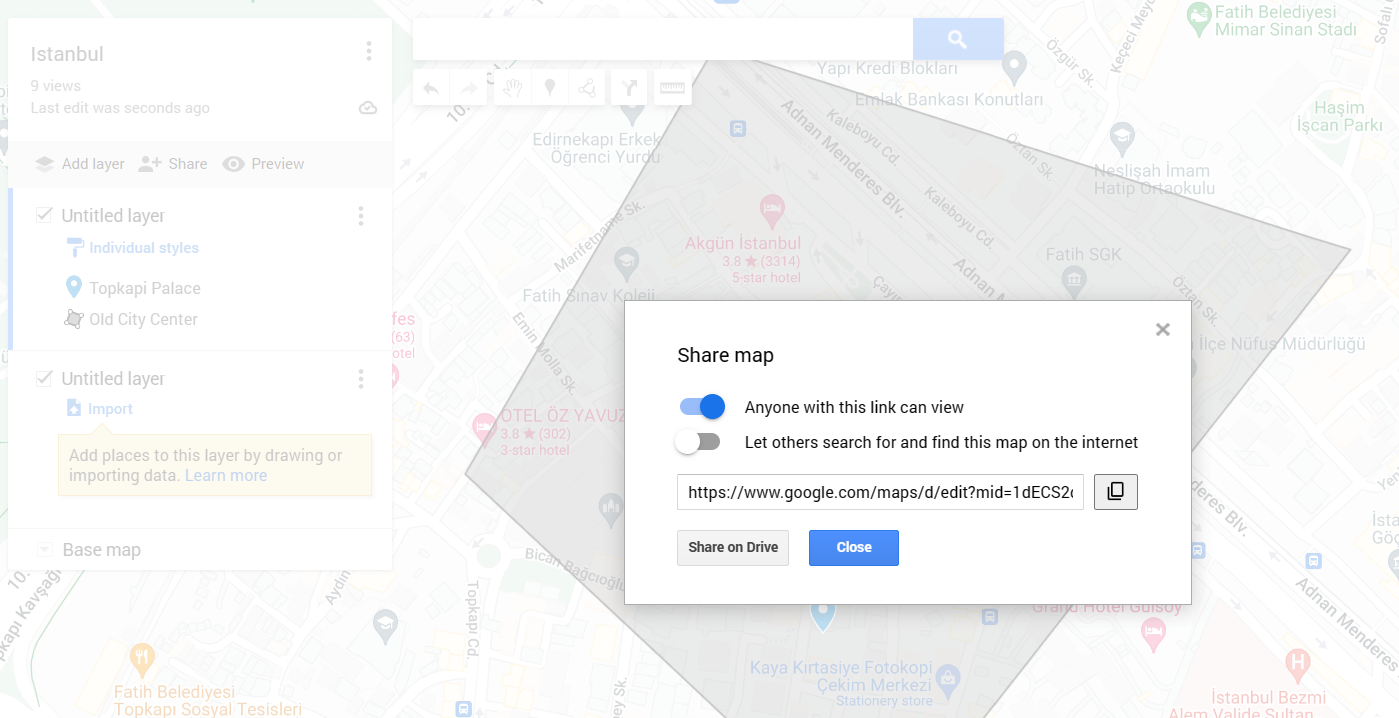
- Step 1: Hit the “Share” Icon to make your map public
Step 2: Select “Anyone with this link can view” AND “Let others search for and find map on the internet”
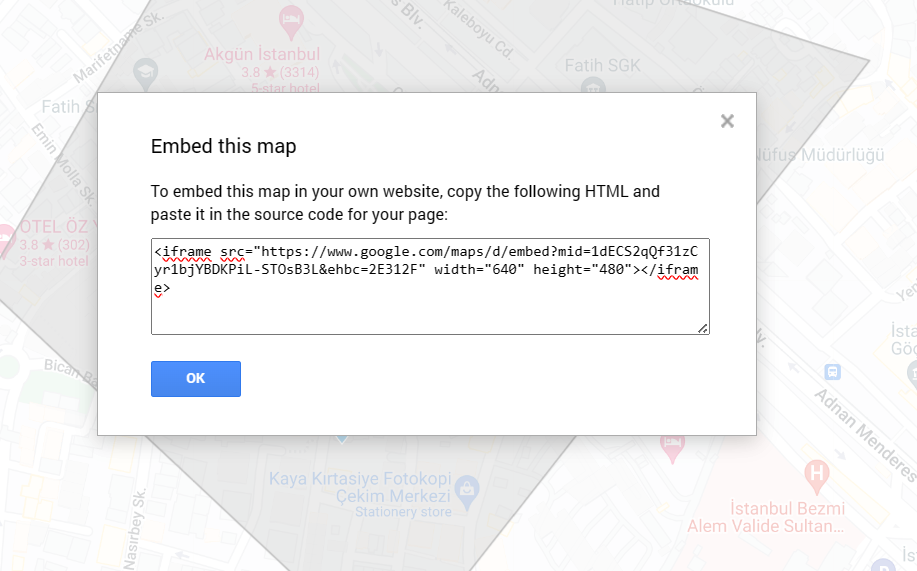
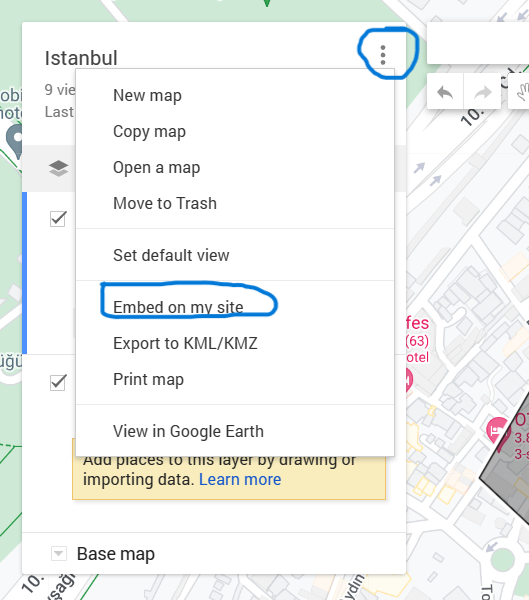
Step 3: Navigate to the 3 dots next to your title, then select “Embed on my site”
Step 4: Follow the same embed instructions for WordPress and Omeka found on the Resources tab.